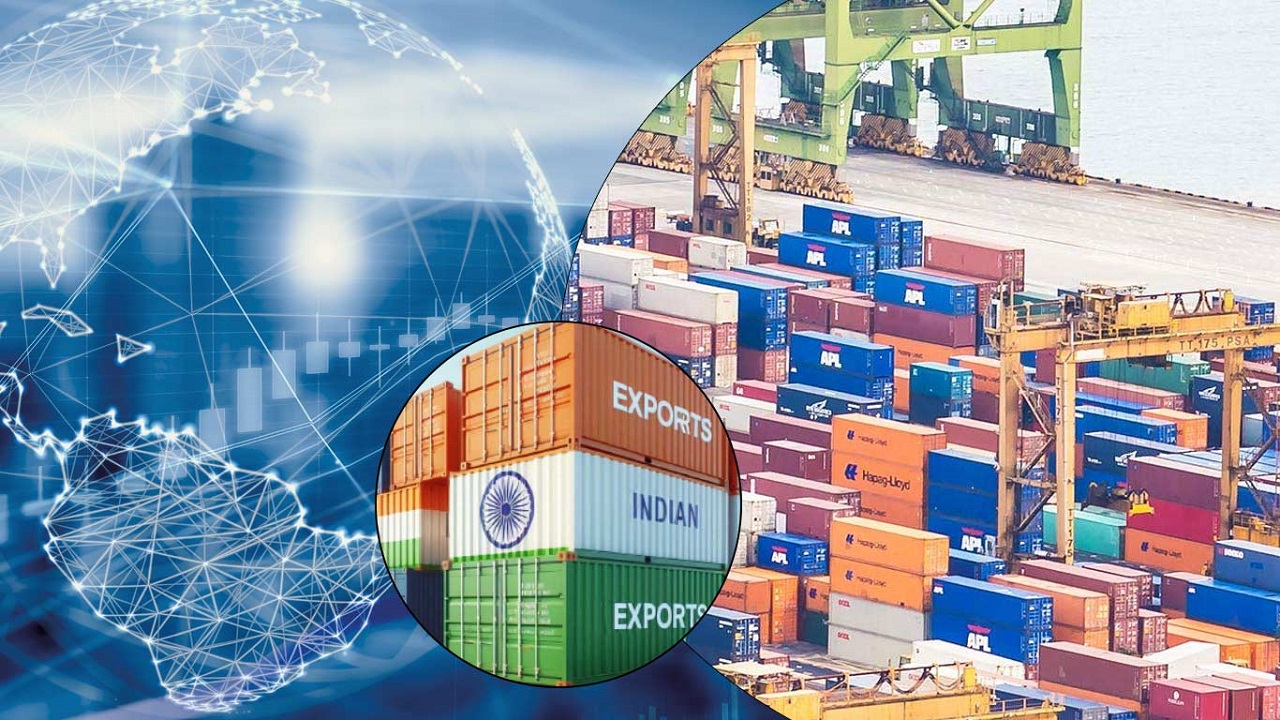
From Goods to Services: India’s Evolving Trade Landscape
Context
While international trade is often perceived as the exchange of physical goods across borders, a significant portion of global commerce now involves intangibles such as services, remittances, capital, data, and ideas.
In India’s case, these invisible flows have overtaken merchandise trade in shaping the country’s external sector.
Despite this shift, India’s trade discourse continues to focus largely on goods, missing the growing significance of invisibles.
India’s Evolving Trade Landscape: Tangibles vs. Intangibles
-
India’s merchandise exports rose from $66.3 billion in 2003–04 to $318.6 billion in 2013–14.
-
This was followed by a slowdown, with exports reaching $456.1 billion in 2022–23, and then declining to $441.8 billion in 2024–25.
-
In contrast, invisible receipts (services and remittances) showed consistent growth, increasing from $53.5 billion in 2003–04 to $576.5 billion in 2024–25.
-
In 2013–14, merchandise exports exceeded invisibles by $85 billion. By 2024–25, invisibles exceeded goods exports by $135 billion.
India’s Invisible Trade: Components and Significance
-
In 2024–25, services exports contributed $387.5 billion to India’s invisible receipts, up from $26.9 billion in 2003–04 and $151.8 billion in 2013–14.
-
Private transfers or remittances stood at $135.4 billion in 2024–25, compared to $22.2 billion in 2003–04 and $69.6 billion in 2013–14.
-
These include earnings from the global Indian workforce, especially in the Gulf, North America, and Europe.
-
India’s services exports include software ($180.6 billion), business, financial, and communication services ($118 billion), and professional services like consultancy, auditing, and legal analysis.
Resilience of Invisibles Compared to Goods
-
Unlike merchandise exports, invisibles have shown resilience to global shocks, including economic downturns and geopolitical crises.
-
Their growth is not dependent on trade agreements or export incentives.
-
Despite this, trade negotiations, especially with countries like the US, continue to focus on tariffs for physical goods such as textiles and agriculture.
-
India’s real trade strength lies in services and human capital, which remain underrepresented in trade talks.
India vs China: Contrasting Trade Models
-
India’s goods trade deficit increased from $147.6 billion in 2013–14 to $287.2 billion in 2024–25, driven by imports of $729 billion against exports of $441.8 billion.
-
Meanwhile, net invisible receipts rose from $115.3 billion in 2013–14 to $263.8 billion in 2024–25, helping contain the current account deficit to $23.4 billion.
-
In contrast, China recorded a goods trade surplus of $768 billion in 2024, with exports at $3,409 billion and imports at $2,641 billion.
-
However, China faced a services trade deficit, importing $613 billion and exporting $384 billion, resulting in a net invisibles deficit of $344.1 billion.
-
While China is known as the “factory of the world”, India is emerging as the “office of the world” with its services-led trade surplus of $188.8 billion, supported by remittances.
Conclusion
India’s foreign trade strategy must adapt to the growing dominance of invisibles.
Recognizing and integrating services, remittances, and human capital into trade policy is essential for accurately understanding India’s global economic engagement and for shaping future trade agreements.

Comments (0)